Why Record Highs Are the Most Dangerous Time to Retire 2
The S&P 500 closed January 2026 at 6,939 — just seven points below its all-time high.
Financial media is running headlines about a historic three-year winning streak. Your 401(k) statement probably looks better than it has in years.
And if you’re planning to retire this year, that might be the most dangerous number you’ve ever seen.
Not because a crash is guaranteed. Nobody can predict that. But because the math of retirement works differently than the math of accumulation — and the current market environment has created a set of conditions that most people approaching retirement don’t fully understand.
This isn’t a prediction. It’s an explanation of a mathematical reality that affects every person drawing income from a portfolio in 2026.

The Pattern That Should Concern You
The S&P 500’s 16.39% price return in 2025 marked its third consecutive year of double-digit gains. That sounds like good news. Historically, it’s a warning sign. Technical analysts who track long-term market cycles note that the aggressive, nearly vertical recovery pattern we saw in 2025 has only occurred twice in the last 125 years: 1980 and 1999.
Both preceded significant market corrections. Those prior periods aligned with 45-year and 26-year cycle tops — and institutional cycle analysis suggests those same forces are now the prevailing drivers of market direction.
As January ended, almost every major cycle tracked by institutional analysts pointed toward a period of impending volatility. The Magnificent 7 stocks, Bitcoin, and high-beta growth names — the usual first dominoes — are already showing emerging weakness.
Critical technical support for the S&P 500 sits between 6,552 and 6,345. That’s a potential 5-9% decline from current levels, and a failure to hold those levels would likely signal the beginning of a multi-month corrective phase.
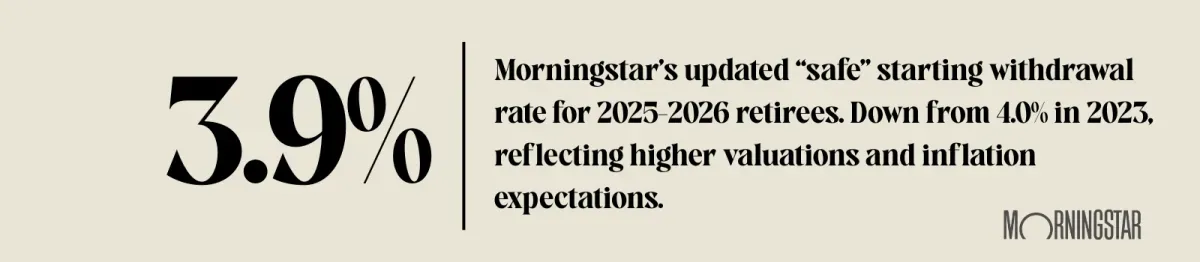
If you have $1 million in the market and we see a correction to the lower support level, you’re looking at a potential $90,000 decline before the correction even gets serious. For someone living off their portfolio, that’s not an abstract number — that’s 18 months of income at a 4% withdrawal rate.
Sequence of Returns: The Risk Nobody Explains Clearly
During your working years, a market crash is actually helpful — you buy more shares at lower prices. Dollar-cost averaging turns volatility into an advantage.
The moment you start withdrawing, that math reverses completely. It’s called sequence of returns risk, and it’s the single biggest mathematical threat facing anyone retiring in 2026.
Here’s how it works:
Imagine a $1,000,000 portfolio that drops 50% in the first year of retirement.
You still need $50,000 for living expenses.
After the withdrawal, you’re left with $450,000.
That remaining balance now needs a 100% gain — a full doubling — just to get back to $900,000. Not your original million. Nine hundred thousand. You’re permanently behind.
This isn’t a worst-case hypothetical. It’s the math that applies to every retiree who draws income from a falling portfolio. And the effect compounds: a 20% drawdown combined with a 4% withdrawal rate in the first year of retirement creates what researchers call a “mathematical death spiral” where the portfolio may never recover to its original principal, even if the market eventually returns to pre-correction levels.